CentOS 8 のインスタンスを作成しましたが、最後に残っていた、ClooudWatch Agent のインストールと、メモリーやディスク容量の監視方法を記載したいと思います。
CPU使用率監視は標準で利用できるのですが、メモリーやディスク容量はCloudWatch Agentを入れないと監視できないので注意が必要です。
7. AWS CloudWatch Agent をインストールして、メモリーやディスク容量を監視できるようにする
-1. IAM ロールに CloudWatch権限を付与する
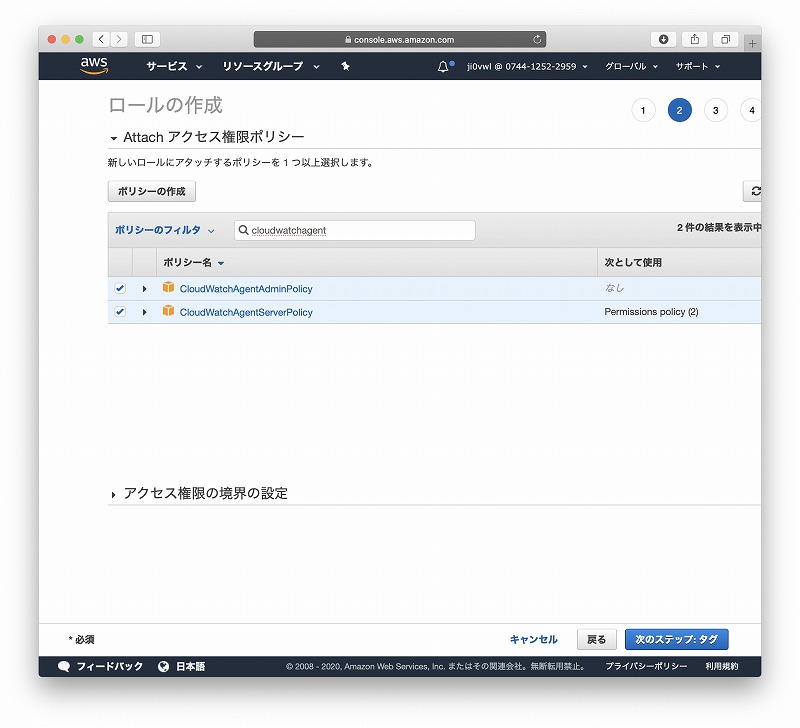
SSM権限を付与したロールをCentOS 8にアタッチしましたが、このロールに以下のCloudWatchアクセス権限を付与します。もしくはSSMとCloudWatchの権限を含む、新しいロールを作っても良いです。新しいロールを作成した場合は、EC2インスタンスへの再アタッチが必要です。
・CloudWatchAgentAdminPolicy
・CloudWatchAgentServerPolicy
-2. CloudWatch Agentをインストール
インスタンスにSSMログインして、以下のコマンドを実行します。
$ sudo dnf install -y wget
$ sudo wget https://s3.amazonaws.com/amazoncloudwatch-agent/redhat/amd64/latest/amazon-cloudwatch-agent.rpm
$ sudo dnf install -y amazon-cloudwatch-agent.rpm
-3. CloudWatch Agentの設定
インストールが終わったら、対話式で設定を進めていきます。最低限の設定としましたが、お好みで変更してください。
$ sudo /opt/aws/amazon-cloudwatch-agent/bin/amazon-cloudwatch-agent-config-wizard
=============================================================
= Welcome to the AWS CloudWatch Agent Configuration Manager =
=============================================================
On which OS are you planning to use the agent?
1. linux
2. windows
default choice: [1]:
1
Trying to fetch the default region based on ec2 metadata...
Are you using EC2 or On-Premises hosts?
1. EC2
2. On-Premises
default choice: [1]:
1
Which user are you planning to run the agent?
1. root
2. cwagent
3. others
default choice: [1]:
1
Do you want to turn on StatsD daemon?
1. yes
2. no
default choice: [1]:
1
Which port do you want StatsD daemon to listen to?
default choice: [8125]
8125
What is the collect interval for StatsD daemon?
1. 10s
2. 30s
3. 60s
default choice: [1]:
3
What is the aggregation interval for metrics collected by StatsD daemon?
1. Do not aggregate
2. 10s
3. 30s
4. 60s
default choice: [4]:
4
Do you want to monitor metrics from CollectD?
1. yes
2. no
default choice: [1]:
1
Do you want to monitor any host metrics? e.g. CPU, memory, etc.
1. yes
2. no
default choice: [1]:
1
Do you want to monitor cpu metrics per core? Additional CloudWatch charges may apply.
1. yes
2. no
default choice: [1]:
2
Do you want to add ec2 dimensions (ImageId, InstanceId, InstanceType, AutoScalingGroupName) into all of your metrics if the info is available?
1. yes
2. no
default choice: [1]:
1
Would you like to collect your metrics at high resolution (sub-minute resolution)? This enables sub-minute resolution for all metrics, but you can customize for specific metrics in the output json file.
1. 1s
2. 10s
3. 30s
4. 60s
default choice: [4]:
4
Which default metrics config do you want?
1. Basic
2. Standard
3. Advanced
4. None
default choice: [1]:
1
Current config as follows:
{
......
}
Are you satisfied with the above config? Note: it can be manually customized after the wizard completes to add additional items.
1. yes
2. no
default choice: [1]:
1
Do you have any existing CloudWatch Log Agent (http://docs.aws.amazon.com/AmazonCloudWatch/latest/logs/AgentReference.html) configuration file to import for migration?
1. yes
2. no
default choice: [2]:
2
Do you want to monitor any log files?
1. yes
2. no
default choice: [1]:
2
Saved config file to /opt/aws/amazon-cloudwatch-agent/bin/config.json successfully.
Current config as follows:
{
......
}
Please check the above content of the config.
The config file is also located at /opt/aws/amazon-cloudwatch-agent/bin/config.json.
Edit it manually if needed.
Do you want to store the config in the SSM parameter store?
1. yes
2. no
default choice: [1]:
1
What parameter store name do you want to use to store your config? (Use 'AmazonCloudWatch-' prefix if you use our managed AWS policy)
default choice: [AmazonCloudWatch-linux]

Trying to fetch the default region based on ec2 metadata...
Which region do you want to store the config in the parameter store?
default choice: [ap-northeast-1]

Which AWS credential should be used to send json config to parameter store?
1. AKIxxxxxxxxxxxxxxxxxxxx(From SDK)
2. Other
default choice: [1]:
1
Successfully put config to parameter store AmazonCloudWatch-linux.
Program exits now.
-4. CloudWatch Agent の起動
これでインスタンスのディスク容量やメモリ使用率などがCloudWatchにあがるようになります。
$ sudo /opt/aws/amazon-cloudwatch-agent/bin/amazon-cloudwatch-agent-ctl -m ec2 -a start
$ sudo systemctl enable amazon-cloudwatch-agent.service
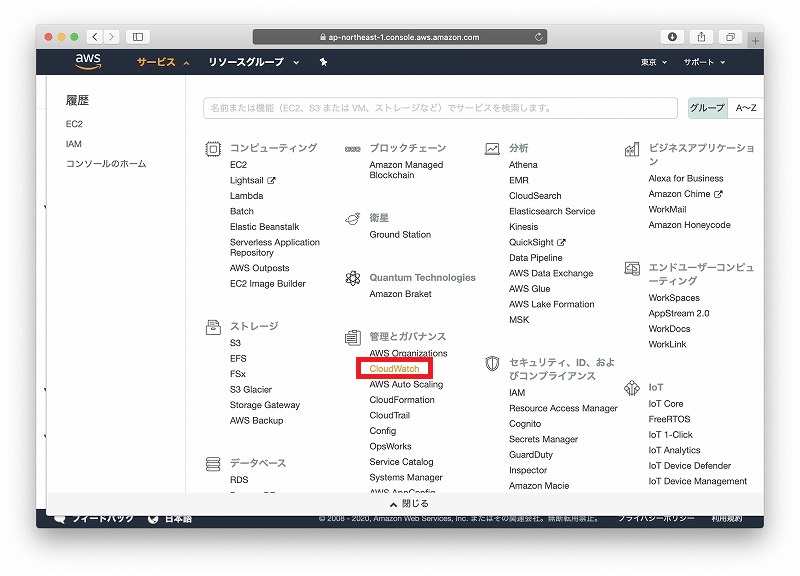
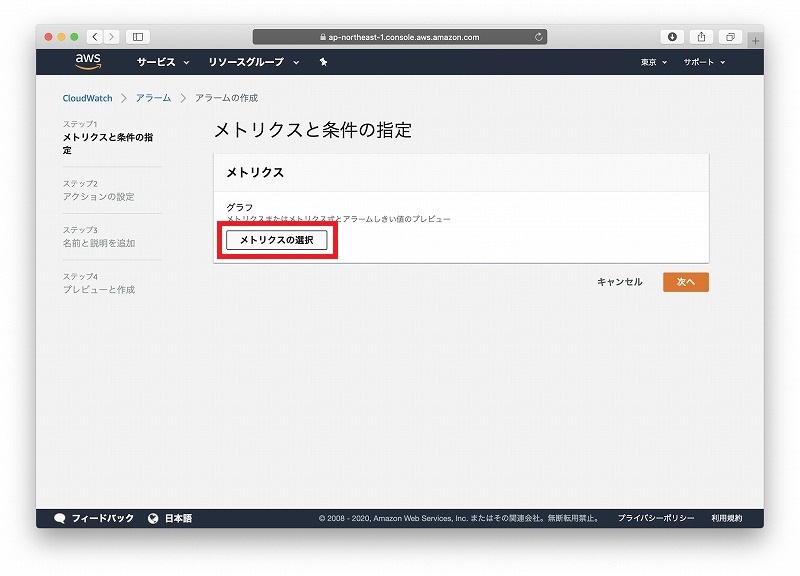
-5. CloudWatchメトリクスを監視項目に追加
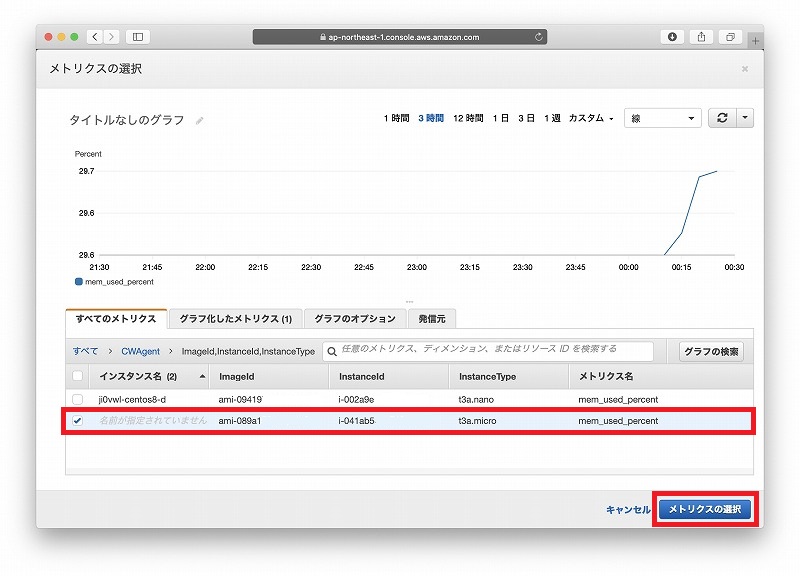
CloudWatch から 、インスタンスから上がってくるストレージ容量、メモリ使用率を監視項目に追加します。
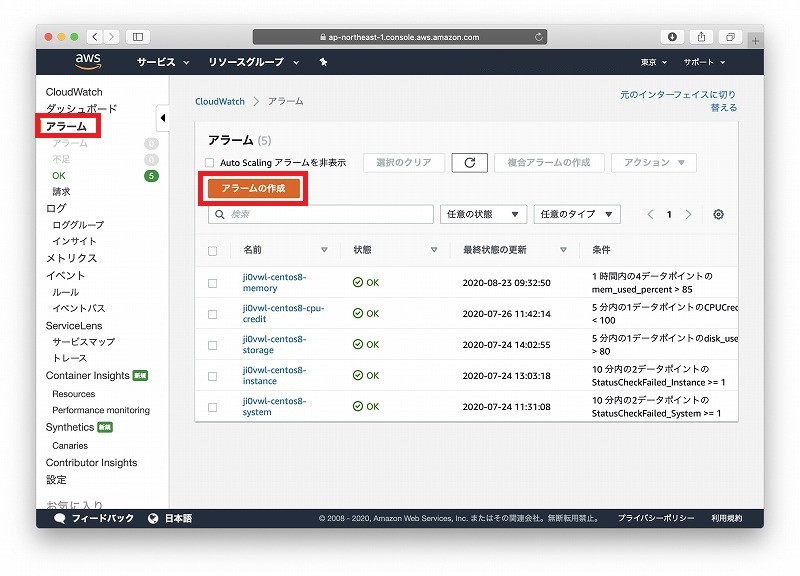
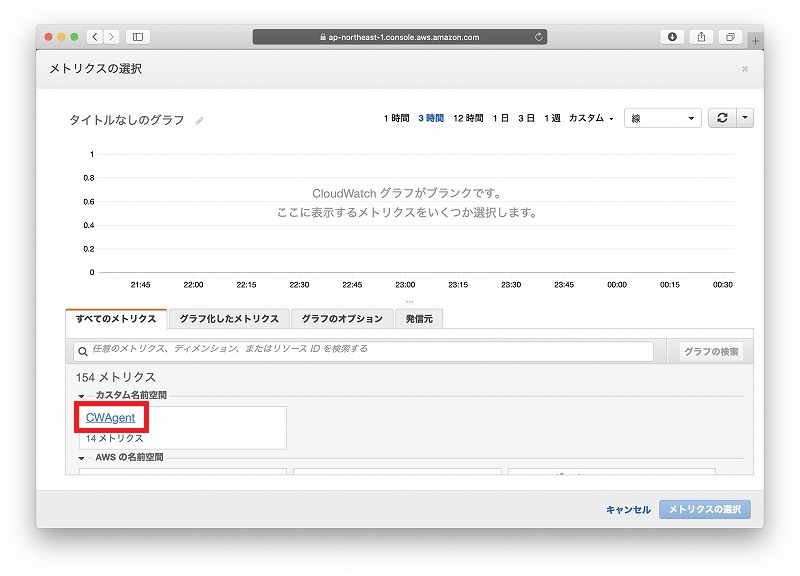
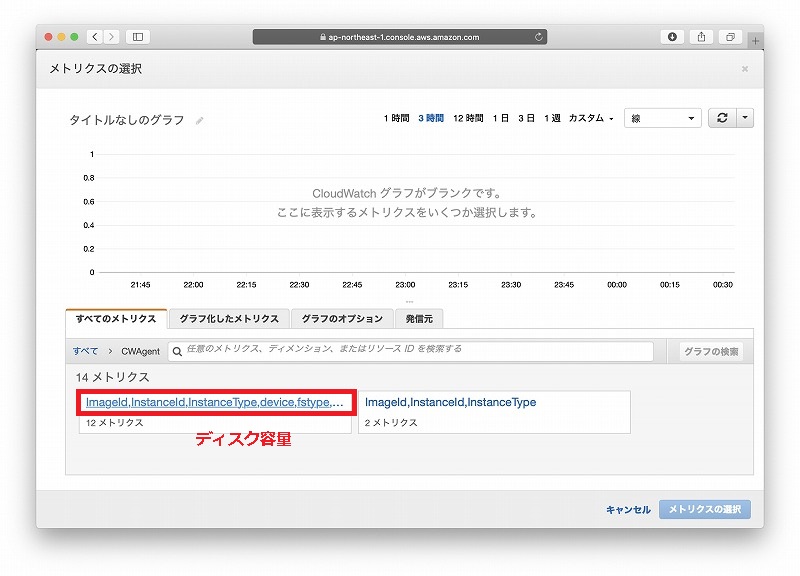
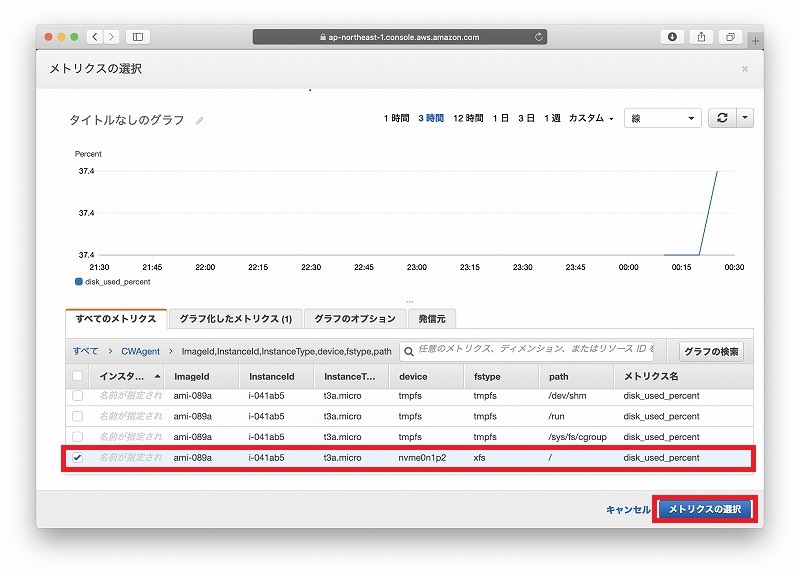
ディスク容量はこちらから。
メモリー使用率はこちらから。 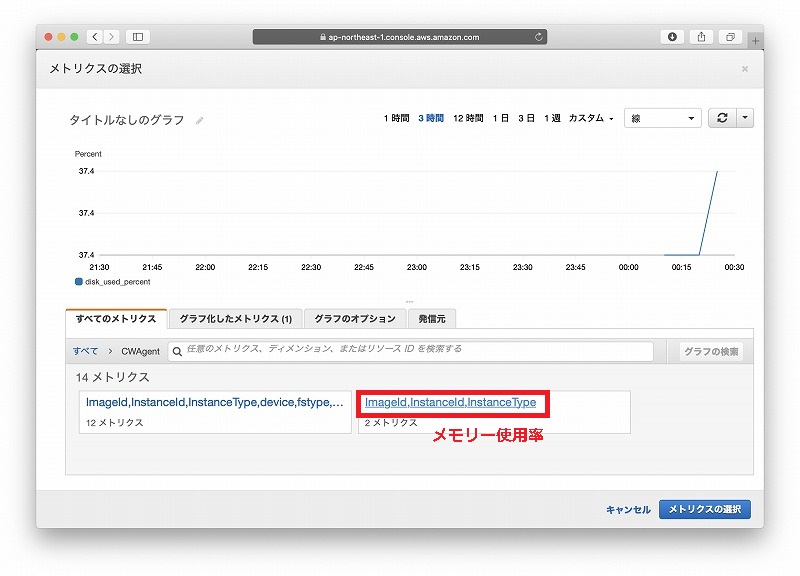
標準ではCPU使用率しか監視できませんでしたが、これでストレージ容量やメモリーの逼迫も自動で監視して通知を受けることで安心してサーバーを維持することができるようになりました。